

What to Know About the Evening Star Candlestick Pattern in Stock Market Trading
/If you’re a stock market trader, you may have heard of the evening star candlestick pattern. Traders use this technical analysis tool to determine bearish reversal patterns in stock prices. The evening star pattern consists of three candles whose shape and color can recognize. Let’s take a closer look at this pattern, how it’s interpreted, and why it matters for traders.
What Does the Evening Star Pattern Look Like?
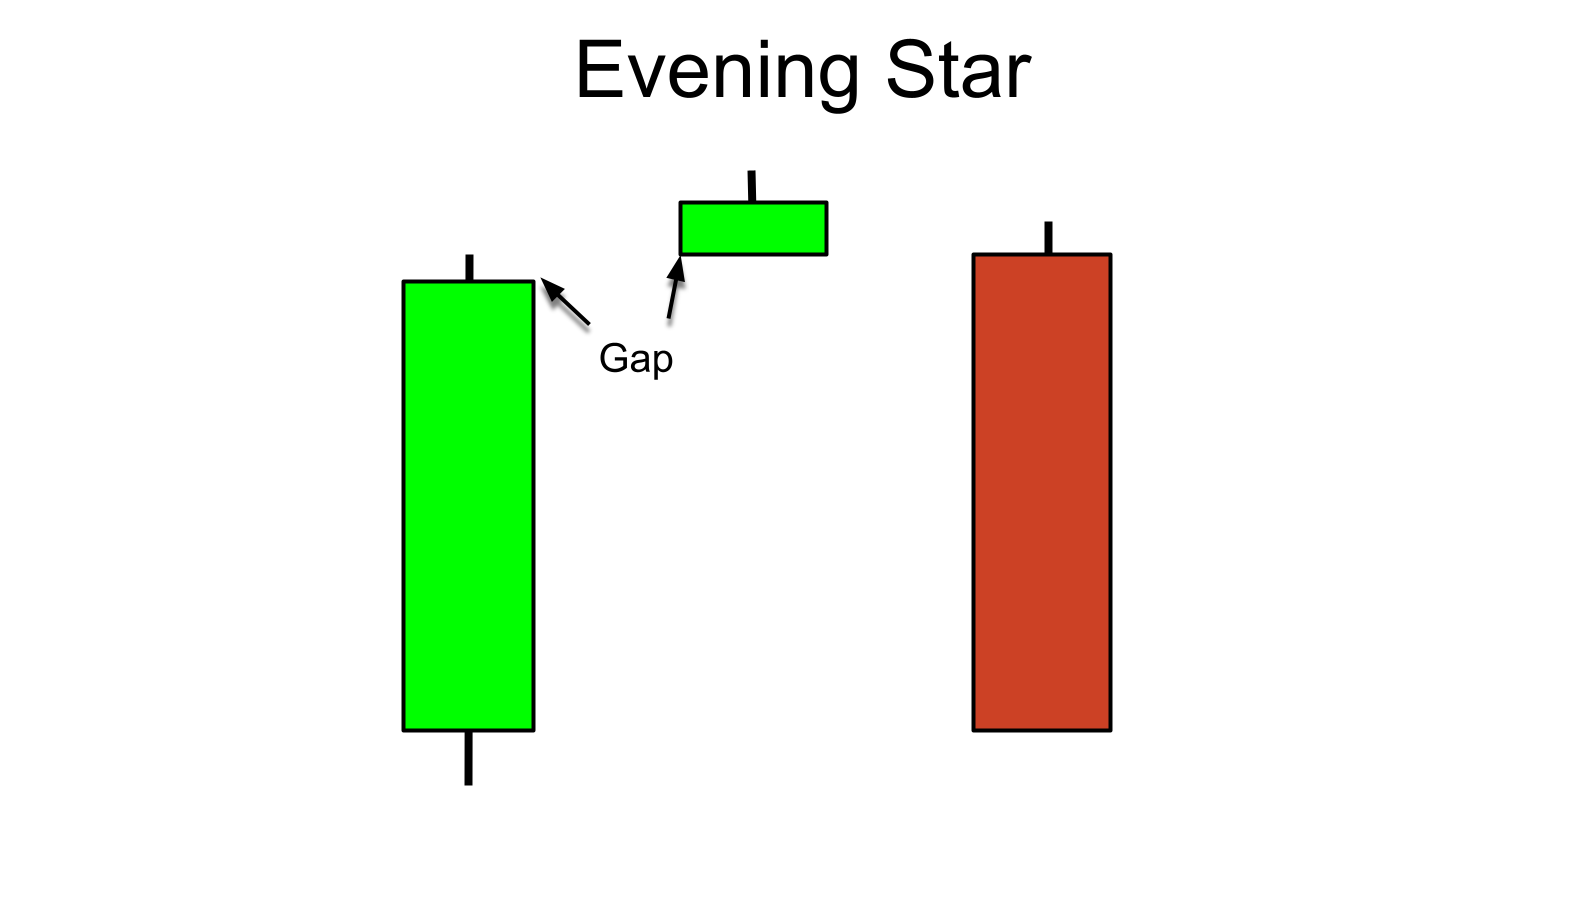
The evening star candlestick pattern is made up of three candles. The first candle is bullish and long, meaning that it opens lower than the closing price. The second candle is short and neutral, meaning its opening and closing prices are roughly equal. The third candle is bearish and long, meaning its opening price is higher than its closing price. This signals to traders that a bearish reversal may soon occur in the stock market.
How Is It Interpreted?
The interpretation of this pattern depends on the context of its formation—in other words, what preceded it? If the evening star appears after an uptrend in prices, then this could signal that the trend will soon reverse itself as bears enter the market. On the other hand, if it appears after a downward trend or consolidation period, this could signal that bulls are entering the market and pushing prices back up again. In either case, understanding how to interpret this pattern correctly can be essential for successful trading decisions.
Why Does It Matter For Traders?
The importance of recognizing these patterns lies not only in understanding where current trends are headed but also in being able to anticipate future ones. By recognizing when specific patterns form—and interpreting them correctly—traders can make more informed decisions about buying or selling stocks to maximize profits while minimizing risk exposure. Furthermore, being able to identify these patterns can also help traders understand when they should stay away from specific trades altogether in order to avoid potential losses down the line.
Conclusion:
Recognizing and interpreting candlestick patterns such as evening stars can be incredibly beneficial for stock market traders who want to make informed decisions about when (and when not) to trade stocks for maximum profitability with minimal risk exposure. Understanding what these patterns look like and how they’re interpreted can give traders an edge over their competition, who may not have access to such information or insight into upcoming trends in stock markets around the world. As always, though, caution should be taken when making trading decisions; knowledge of technical analysis tools like these can only get you so far!